Total U.S. #PetIndustry Expenditures
| Year | Billions of Dollars |
| 2025 | $157 Projected |
| 2024 | $151.9 |
| 2023 | $147.0 |
| 2022 | $136.8 |
| 2021 | $123.6 |
| 2020 | $103.6 |
| 2019 | $97.1 |
| 2018 | $90.5 |
2024 ACTUAL SALES IN THE U.S. MARKET
$152 billion spent on pets in 2024
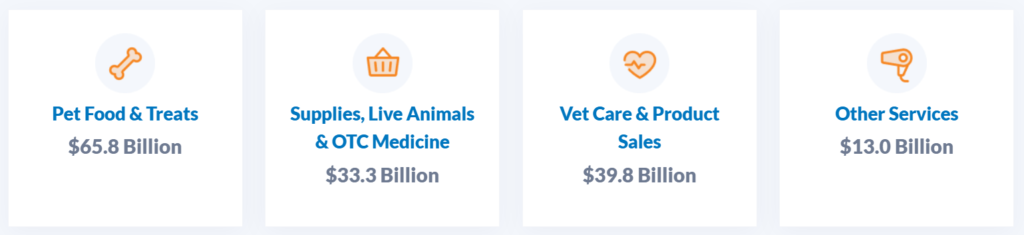
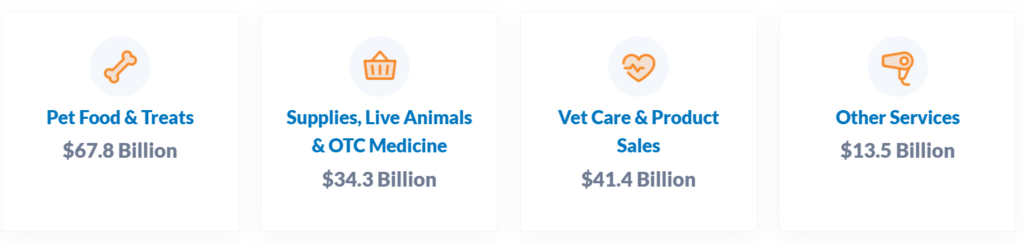
*Other Services category includes boarding, grooming, insurance, training, pet sitting, pet walking, and all services outside of veterinary care.
2025 PROJECTED SALES IN THE U.S. MARKET
$157 billion in sales projected
2025 APPA National Pet Owners Survey Stats
According to the 2025 APPA National #PetOwners Survey as cited in APPA’s 2025 State of the Industry Report, 94 million U.S. households own a pet. Below, we report on the pet ownership statistics by species-type and by generational segment.
Number of U.S. Households That Own a Pet
| Households | |
| Bird | 6 million |
| Cat | 49 milion |
| Dog | 68 million |
| Horse | 2 million |
| Freshwater Fish | 10 million |
| Saltwater Fish | 2 million |
| Reptile | 6 million |
| Small Animal | 6 million |
Pet Ownership by Generation
| % of Pet Owners | |
| Gen Z | 20% |
| Millennial | 30% |
| Gen X | 25% |
| Baby Boomer | 25% |
Source: APPA